

Standard deviation channels are a technical analysis tool consisting of three lines: a central moving average and two outer bands placed a defined number of standard deviations above and below it. They visualise how far price has moved from its statistical mean, helping traders identify overbought and oversold conditions, trend direction, and volatility breakouts. A 2-standard deviation channel statistically captures approximately 95% of price movements, making it the most widely used setting in crypto analysis.
Key Takeaways
- Standard deviation channels consist of a middle moving average and two outer bands at a set number of standard deviations. A 2-SD channel captures approximately 95% of price movement, providing a statistically grounded framework for trade decisions.
- These channels are most effective in trending markets. In sideways or consolidating markets, price oscillates across the middle line without directional momentum, generating false signals that require confirmation from other indicators.
- Advanced strategies combining standard deviation channels with Bollinger Bands, multiple moving averages, Fibonacci retracement levels, and volume indicators produce more reliable signals by adding confirmation layers.
- The channels are lagging indicators based on historical price data and cannot predict future price movements. They measure past volatility and trend, not forward direction.
- Standard deviation channels can be used for risk management by setting stop-losses just outside the channel boundary, providing volatility-adjusted stop levels that reflect the asset’s actual recent price range.
- Platform tools like TradingView and MetaTrader (MT4/MT5) plot standard deviation channels automatically. Traders adjust moving average period and standard deviation levels to match their timeframe and strategy.
Read Also: How to Interpret Crypto Market Patterns for Successful Trading
What Is Standard Deviation and How Does It Apply to Price?
Standard deviation is a statistical measure of how much a set of values disperses from their mean (average). A small standard deviation means most values cluster close to the average; a large standard deviation means values are spread across a wider range. In financial markets, standard deviation measures price volatility: how dramatically an asset’s price swings around its average level.
How Is Standard Deviation Calculated for a Crypto Asset?
The calculation follows five steps, which charting platforms perform automatically but which traders benefit from understanding conceptually:
Standard Deviation Calculation (5 Steps) Step 1: Calculate the mean (average) price over the selected period
Step 2: Subtract the mean from each individual price to find each deviation
Step 3: Square each deviation (to eliminate negative values)
Step 4: Average the squared deviations = Variance
Step 5: Take the square root of the variance = Standard Deviation
Worked Example: ETH Over Five Days
Suppose Ethereum’s closing prices over five days are $2,000, $2,050, $1,980, $2,100, and $2,030. The mean is $2,032. The deviations are -32, +18, -52, +68, and -2. Squaring those gives 1,024, 324, 2,704, 4,624, and 4. The variance is 1,736. The standard deviation is approximately $41.66, meaning Ethereum’s daily price moved an average of $41.66 from its mean over that five-day window. Wider values during high-volatility periods expand the channel; narrower values during quiet periods contract it.
What Are Standard Deviation Channels?
Standard deviation channels translate this statistical measure into a visual trading tool. The channel consists of three lines drawn directly on a price chart:
- Middle line: A moving average (typically a simple moving average or exponential moving average over a chosen period, most commonly 20, 50, or 100 periods).
- Upper band: The moving average plus a specified number of standard deviations.
- Lower band: The moving average minus the same number of standard deviations.
The middle line represents the prevailing trend direction. The outer bands represent statistically significant levels of price extension above or below the trend. The number of standard deviations chosen determines how wide the bands are and how many price movements fall inside them.
Over 60% of traders use technical analysis tools including standard deviation channels to make informed decisions, confirming their place in mainstream crypto charting practice. On charting platforms like TradingView and MetaTrader, the channel plots automatically when you select the indicator and enter your parameters.
Read Also: Bollinger Bands Demystified: A Beginner’s Guide
How Do You Build a Standard Deviation Channel?
Step 1: Select a Moving Average
The middle line of the channel is a moving average. Traders can use either a simple moving average (SMA) or an exponential moving average (EMA). The most common settings are a 20-period moving average for short-term analysis and a 50-period or 100-period average for swing traders and longer-term analysis. An EMA gives more weight to recent prices and reacts faster; an SMA weights all periods equally and is smoother. For most crypto applications, the 20-period EMA on the daily chart is the standard starting point.
Step 2: Calculate the Standard Deviation
After selecting the moving average period, the standard deviation is computed for the same number of periods. On TradingView, this is handled automatically when you add the indicator. Most platforms label it “Regression Channel,” “Standard Deviation Channel,” or similar. You then set the number of standard deviations for the outer bands.
Step 3: Define the Band Levels
Choose between 1, 2, or 3 standard deviations based on your strategy. For example, if the 20-day moving average of Bitcoin is $80,000 and the standard deviation is $2,500, a 2-standard deviation channel has an upper band at $85,000 and a lower band at $75,000. Prices outside these bands represent statistically unusual extensions from the mean and are the primary signal zones for the channel.
Step 4: Draw the Channel and Interpret
With the upper and lower bands plotted, prices approaching or breaching the upper band may indicate overbought conditions; prices near or below the lower band may indicate oversold conditions. The middle line acts as dynamic support in uptrends and dynamic resistance in downtrends. These interpretations are tendencies based on mean-reversion statistics, not certainties, and should always be confirmed with additional analysis.
How Do You Adjust Settings for Different Market Conditions?
Highly volatile altcoins may require wider channels (3 standard deviations) to avoid frequent false signals caused by normal intraday price swings. Bitcoin in a calm consolidation phase may be more accurately analysed with a 1-standard deviation setting. During high-impact news events such as regulatory announcements, ETF approvals, or major macroeconomic releases, channels will expand rapidly as volatility spikes, and signals generated immediately after the expansion are less reliable until the volatility normalises.
Join UEEx
Experience the World’s Leading Digital Wealth Management Platform
Sign UP
Read Also: Crypto Market Depth Analysis: All You Need To Know
How Do You Use Standard Deviation Channels in Crypto Trading?
Identifying Overbought and Oversold Conditions
Standard deviation channels help traders spot overbought and oversold conditions by highlighting when price has moved statistically far from its mean. If price breaks above the upper boundary of a 2-standard deviation channel, it may signal that the asset is overbought and due for a correction. If price falls below the lower boundary, it may indicate an oversold condition and a potential rebound. For example, if Ethereum consistently trades near or above the upper boundary of a 2-standard deviation channel, the market may be overextended and traders might consider reducing exposure or tightening stop-losses.
Trend Confirmation and Reversals
The middle moving average line acts as a trend indicator. When price stays above the middle line, it suggests a bullish trend; price below the middle line suggests a bearish trend. Traders use this line to confirm trend strength or identify potential reversals. If Bitcoin is trading above the middle line of a 50-day standard deviation channel and then crosses below it on volume, this may signal a trend reversal. The channel middle line is a more dynamic signal than a static support/resistance level because it adjusts continuously to recent price data.
Volatility Breakouts and Continuations
When price breaks above or below the outer channel boundaries, it can signal a volatility breakout. A breakout above the upper boundary suggests strong bullish momentum; a breakout below the lower boundary signals bearish momentum. However, false breakouts are common in crypto markets, particularly on lower timeframes. Combining standard deviation channels with volume and the Relative Strength Index (RSI) helps confirm whether a breakout has genuine momentum. For example, if Solana breaks above the upper boundary of a 2-standard deviation channel on significantly above-average volume, it may indicate a continuation of the uptrend. A breakout on low volume is more likely to fail and reverse.
What Are the Advanced Strategies Using Standard Deviation Channels?
Strategy 1: Combining with Bollinger Bands
Bollinger Bands share similar construction with standard deviation channels but are more dynamic as they expand and contract with changing volatility. Combining the two provides double confirmation: when both indicators simultaneously signal the same condition, such as price breaking above the upper boundary of both the standard deviation channel and the Bollinger Bands, the probability of a significant move increases meaningfully. If Bitcoin breaks above the upper boundary of both a 2-standard deviation channel and Bollinger Bands on the daily timeframe, this dual confirmation strengthens the bullish breakout signal. Conversely, a break below both lower boundaries on high volume strengthens the bearish case.
Strategy 2: Trend Continuation with Multiple Moving Averages
Combining standard deviation channels with a 50-period and 100-period moving average overlay provides a clearer picture of trend direction and strength. The standard deviation channel identifies potential entry points; the moving averages confirm overall trend context. If price is above both the 50-period and 100-period moving averages, and then touches or slightly dips below the middle line of the standard deviation channel, this suggests a potential continuation buy. If price is below both moving averages and touches the middle line from below, this may be a continuation sell signal. Combining multiple timeframe moving averages with the channel reduces the probability of counter-trend entries.
Strategy 3: Volatility-Based Scalping
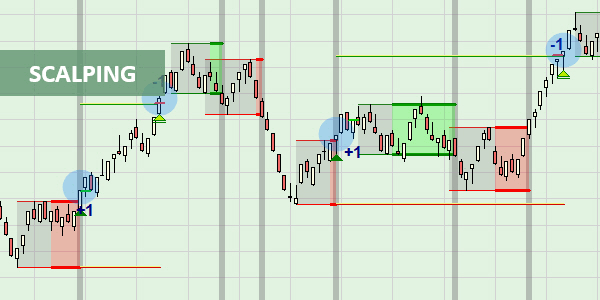
Scalping with standard deviation channels focuses on very short timeframes (5-minute or 15-minute charts) using a 1-standard deviation channel. The tighter bands create more frequent touch points, and scalpers target small reversals at the boundaries. The approach works best in volatile crypto markets where intraday price swings regularly reach the channel boundaries. Set up a 1-standard deviation channel on a 5-minute chart for a volatile asset. Enter a long trade when price touches the lower boundary and shows a reversal candle pattern. Target the middle line or upper boundary as the exit. Strict stop-loss discipline is essential: scalping profits depend on a high win rate with small gains per trade, and a single unmanaged loss can wipe multiple profitable setups.
Strategy 4: Pairing with Fibonacci Retracement Levels
Fibonacci retracement levels (23.6%, 38.2%, 50%, and 61.8%) identify potential support and resistance based on the ratio relationships in the Fibonacci sequence. Confluence between a Fibonacci level and a standard deviation channel boundary significantly strengthens a signal because two independent methods are pointing to the same price level. Draw Fibonacci retracement levels over a significant price move. Apply a standard deviation channel on the same chart. Enter trades where a Fibonacci level aligns with a channel boundary. For example, if Bitcoin is in a downtrend and price touches the lower boundary of a standard deviation channel while simultaneously at the 61.8% Fibonacci retracement level, this double confluence indicates a strong potential support zone and a higher-probability reversal entry.
Strategy 5: Risk Management with Channel Boundaries
Standard deviation channels provide volatility-adjusted stop-loss placement that outperforms arbitrary fixed-dollar stops. Place the stop-loss just outside the relevant channel boundary on the opposite side from your entry: just below the lower boundary for long positions, just above the upper boundary for short positions. Take-profit targets are placed near the opposite boundary. If entering a long position on Cardano near the middle line of a 2-standard deviation channel on the hourly chart, place the stop-loss just below the lower boundary. Set the take-profit target near the upper boundary. This creates a risk-to-reward ratio that is directly calibrated to the asset’s current volatility.
What Are the Recommended Settings for Different Trading Styles?
| Trading Style | Chart Timeframe | Moving Average | SD Setting | Best Paired With |
|---|---|---|---|---|
| Scalping | 5-min, 15-min | 20-period EMA | 1 SD | Volume; order flow; tick charts |
| Day Trading | 1-hour, 4-hour | 20-period SMA/EMA | 2 SD | RSI; Bollinger Bands; volume |
| Swing Trading | Daily, 3-day | 50-period SMA | 2 SD | 50/100-day MAs; Fibonacci levels |
| Position Trading | Weekly | 100-period SMA | 3 SD | MVRV; on-chain metrics; macro indicators |
| Volatile Altcoins | Any | 20-period EMA | 3 SD | Volume filter; ADX for trend confirmation |
Join UEEx
Experience the World’s Leading Digital Wealth Management Platform
Sign UP
What Do Real Crypto Market Case Studies Show?
Standard deviation channels have been applied across multiple market cycles. These case studies illustrate how the tool performs under different conditions, including the updated 2024 to 2025 cycle:
Case Study 1: Bitcoin
Bitcoin’s 2024 to 2025 Post-Halving Bull Run
Following the April 2024 Bitcoin halving, Bitcoin’s price rose from approximately $42,000 at ETF launch in January 2024 to an all-time high of $126,200 in October 2025. During this sustained uptrend, traders using a 50-day standard deviation channel with 2-SD bands observed that Bitcoin consistently held above the middle line, confirming the strength of the trend. Brief pullbacks to the middle line, including the April 2025 correction to approximately $74,000, provided buying opportunities for traders who understood that the channel’s middle line was acting as dynamic support. When Bitcoin approached the upper boundary of the 3-SD channel in late September 2025, it preceded the October peak and subsequent 36% correction.
Key Insight: The middle line of a 50-day standard deviation channel served as reliable dynamic support throughout the 2024 to 2025 bull run. Touches of the 3-SD upper boundary coincided with peak overextension before the late 2025 correction.
Case Study 2: Ethereum
Ethereum During the 2018 Bear Market
In 2018, Ethereum’s price fell from over $1,300 to under $100 as the ICO boom deflated. Traders using the 3-standard deviation channel on the weekly chart identified extreme oversold conditions when Ethereum approached the lower boundary. In September 2018, Ethereum touched the lower band of the 3-SD channel near $170 and produced a temporary relief rally to $240 before the downtrend resumed. This provided a short-term trading opportunity for traders with clearly defined risk management, even in a prolonged bear market.
Key Insight: In bear markets, 3-SD lower boundary touches can identify oversold extremes and short-term relief rallies, but the channel does not signal when the broader downtrend ends. Strict stop-loss placement below the channel boundary is essential.
Case Study 3: Dogecoin
Dogecoin’s 2021 Retail Frenzy
In early 2021, Dogecoin’s price surged from under $0.01 to a high of $0.73 fuelled by social media momentum and celebrity endorsements. Throughout the ascent, DOGE’s price repeatedly traded above the upper boundary of the 2-SD channel on the daily chart, signalling extreme overbought conditions. In May 2021, just before DOGE peaked at $0.73, it was trading well above both the 2-SD and 3-SD channel boundaries simultaneously. Traders who used the 3-SD upper boundary breach as an exit signal were able to reduce exposure before the subsequent correction from $0.73 to $0.40 within a few days.
Key Insight: In momentum-driven meme coin moves, price can sustain above the 2-SD boundary for extended periods. The 3-SD boundary simultaneous breach provides a stronger signal of extreme overextension. Always combine with volume analysis.
Case Study 4: Solana
Solana’s 2024 to 2025 Firedancer-Driven Rally
Solana delivered approximately 280% gains during the 2024 to 2025 cycle, driven by Firedancer validator client optimisations, expanding DeFi activity, and institutional adoption. Traders using a 50-day standard deviation channel observed consistent pattern: pullbacks to the channel middle line coincided with strong accumulation periods, with the SOL price bouncing from the middle line on at least three occasions during the uptrend. When Solana approached the upper 2-SD boundary in the fourth quarter of 2024, it preceded short-term corrections of 15 to 20%, providing swing traders with defined exit and re-entry points.
Key Insight: For trending Layer-1 assets like Solana, the 50-day channel middle line provides systematic accumulation signals during pullbacks, while upper boundary approaches signal appropriate profit-taking levels in swing trading strategies.
Case Study 5: XRP
XRP and SEC Resolution Volatility (2023 to 2025)
XRP experienced significant volatility in connection with the SEC lawsuit, which was substantially resolved by mid-2023 when a court ruled XRP was not a security in programmatic sales. Following this ruling, XRP’s price surged. Traders using 2-SD channels on the daily chart observed XRP breaking above the upper boundary on volume, confirming genuine demand rather than a false breakout. In late 2024 and 2025, XRP continued to benefit from regulatory clarity as the SEC withdrew its appeal, producing additional trend-following channel signals that rewarded traders who held above the middle line during consolidation periods.
Key Insight: Regulatory catalyst events can produce genuine breakouts above the upper channel boundary on volume. The channel helps traders distinguish between brief overextension and a new, higher trend range when combined with news context.
Read Also: Quantitative Analysis of Cryptocurrency Markets
What Are the Limitations of Standard Deviation Channels?
| Limitation | What It Means in Practice | How to Mitigate |
|---|---|---|
| Lagging indicator | Moving average lags price; channels react slowly to sudden moves; entry signals arrive late | Pair with leading indicators (RSI divergence, volume spikes) for early confirmation |
| Poor in sideways markets | In consolidation, price oscillates across the middle line without trend, generating false signals | Use ADX to confirm trend presence before acting on channel signals; avoid trading in low-ADX environments |
| Cannot predict reversals | Upper boundary indicates overextension but not the specific bar or level where reversal will occur | Require a reversal candlestick pattern or RSI divergence to confirm reversal before entry |
| Sensitive to market noise | News events and social media spikes cause rapid channel expansion followed by false signals | Avoid trading the first 1 to 2 bars after a major news spike; wait for volatility to normalise |
| No fundamental input | Channels reflect only historical price; they have no knowledge of regulatory news, protocol upgrades, or macro conditions | Combine with a news calendar and on-chain fundamental metrics (MVRV, active addresses) for context |
| Timeframe dependency | Short timeframes produce excessive noise; long timeframes produce delayed signals; different settings show different pictures | Use a multi-timeframe approach; confirm the channel signal on both the primary trading timeframe and one timeframe higher |
Key principle: Standard deviation channels are most powerful as one tool within a multi-indicator framework. No single technical indicator produces reliable signals in isolation across all market conditions. Combine channel signals with volume confirmation, momentum oscillators (RSI, MACD), and market structure analysis for the highest-probability setups.
Read Also: Fibonacci Retracement in Cryptocurrency Trading
Frequently Asked Questions
How do standard deviation channels help in crypto trading?
Standard deviation channels help crypto traders identify potential trend reversals, support and resistance levels, and overbought or oversold conditions by tracking price deviations from the moving average. The upper boundary signals potential overbought conditions; the lower boundary signals potential oversold conditions. The middle moving average line acts as dynamic support in uptrends and dynamic resistance in downtrends. These channels improve trade timing by providing a statistically grounded framework for understanding where price is relative to its recent trend.
Can standard deviation channels predict future price movements?
No. Standard deviation channels are lagging indicators based on historical price data. They help traders understand current trends and identify statistically significant price levels, but they do not forecast what price will do next. A price at the upper boundary has historically been associated with mean reversion, but in strongly trending markets, prices can remain elevated near boundaries for extended periods. Always combine channel analysis with forward-looking indicators like volume, RSI divergence, or order flow for a more complete picture.
What is the best timeframe for using standard deviation channels in crypto markets?
The best timeframe depends on your trading strategy. For scalping and day trading, 5-minute or 15-minute charts with a 20-period moving average work well for identifying intraday reversals. For swing trading, daily charts with 50-period moving averages provide clearer trend and channel boundary signals. For long-term position trading, weekly charts with 100-period moving averages and 3-standard deviation bands smooth out short-term noise. Most traders confirm signals across at least two timeframes before entering a position.
Are standard deviation channels more effective in trending markets?
Yes. Standard deviation channels are significantly more effective in trending markets, where price regularly touches the upper or lower boundary and the middle line acts as reliable dynamic support or resistance. In sideways or ranging markets, price oscillates across the middle line without directional momentum, generating frequent false signals. Confirm trend presence using a directional indicator like ADX before relying on channel boundary signals. If ADX is below 20, the market is ranging and channel signals should be treated with extra caution.
How do I use standard deviation channels to set stop-losses?
Place stop-losses just outside the channel boundary on the opposite side from your entry. For a long position, place the stop-loss just below the lower boundary; for a short position, just above the upper boundary. This approach sizes stop-losses to the asset’s actual recent volatility rather than using arbitrary fixed-dollar distances. Take-profit targets are logically set near the opposite channel boundary. This creates a risk-to-reward ratio directly calibrated to current market conditions, which is one of the practical advantages of volatility-based stop placement over fixed stops.
Join UEEx
Experience the World’s Leading Digital Wealth Management Platform
Sign UP